Documentation for macOS

#Debugging with Dumps
The Dumps feature can automatically intercept all dump() calls in your code and display them in a separate window instead of rendering them in the browser or CLI. But that's not all, it can also show HTTP requests, logs, Eloquent queries, dispatched jobs and Blade views to give you all the integrations that you need when debugging your app.
#Using Dump features
You may open the Dumps Window via the Herd system tray menu or open it with a globally configurable shortcut that you can define in the shortcut settings.
In order to enable dump interception and record debug information, click on the antenna icon in the title bar of the window. The icon will flash to indicate that dump interception is enabled.
Once enabled, you may use the dump() function as usual. Instead of printing the dump to your browser or terminal, Herd will open a window when a new dump becomes available.
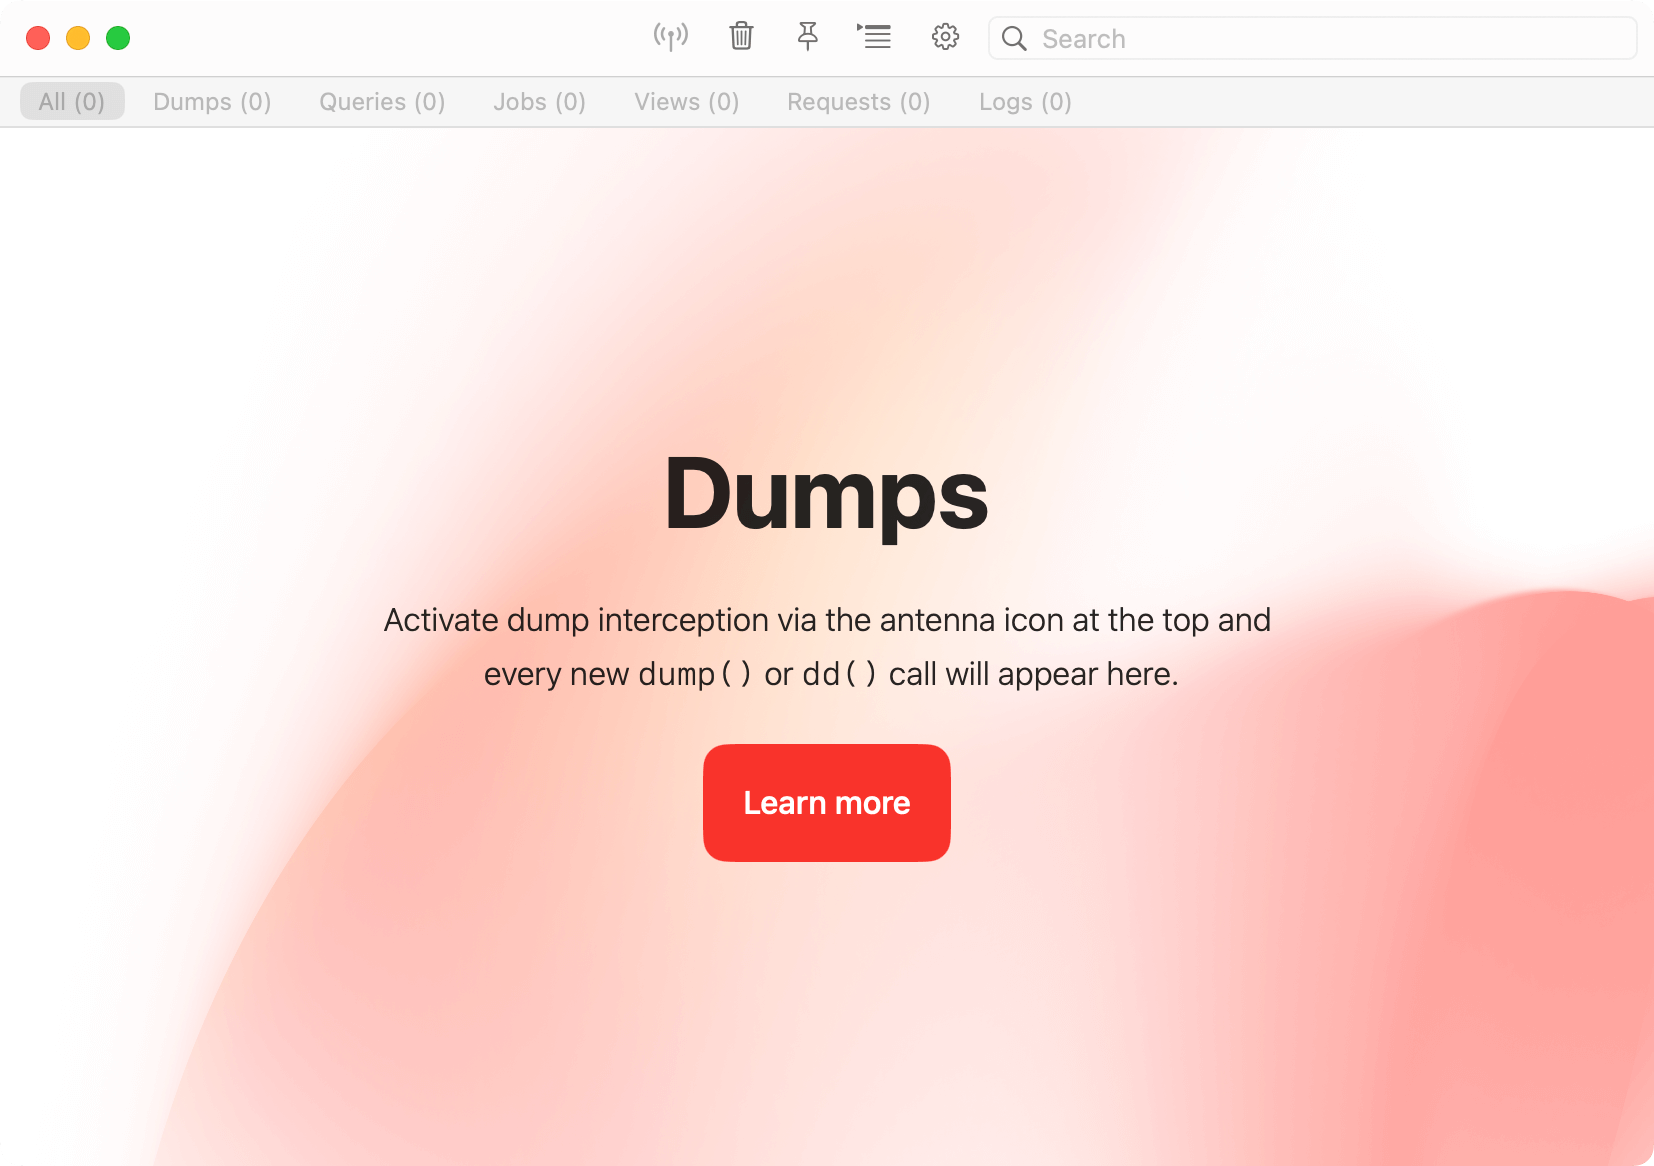
New dumps are automatically added to the top of the window, and you can clear the window by pressing the icon in the title bar of the dump window. All dumps are searchable so you can easily find what you are looking for.
By default, Herd only displays the output of the latest request, but you can enable persistent storage between requests in the settings. This keeps a history until you close the Dumps Window.
#Settings
You can select which features you need when you start debugging, so that your requests stay as fast as usual and there's no bloat when digging into a problem.
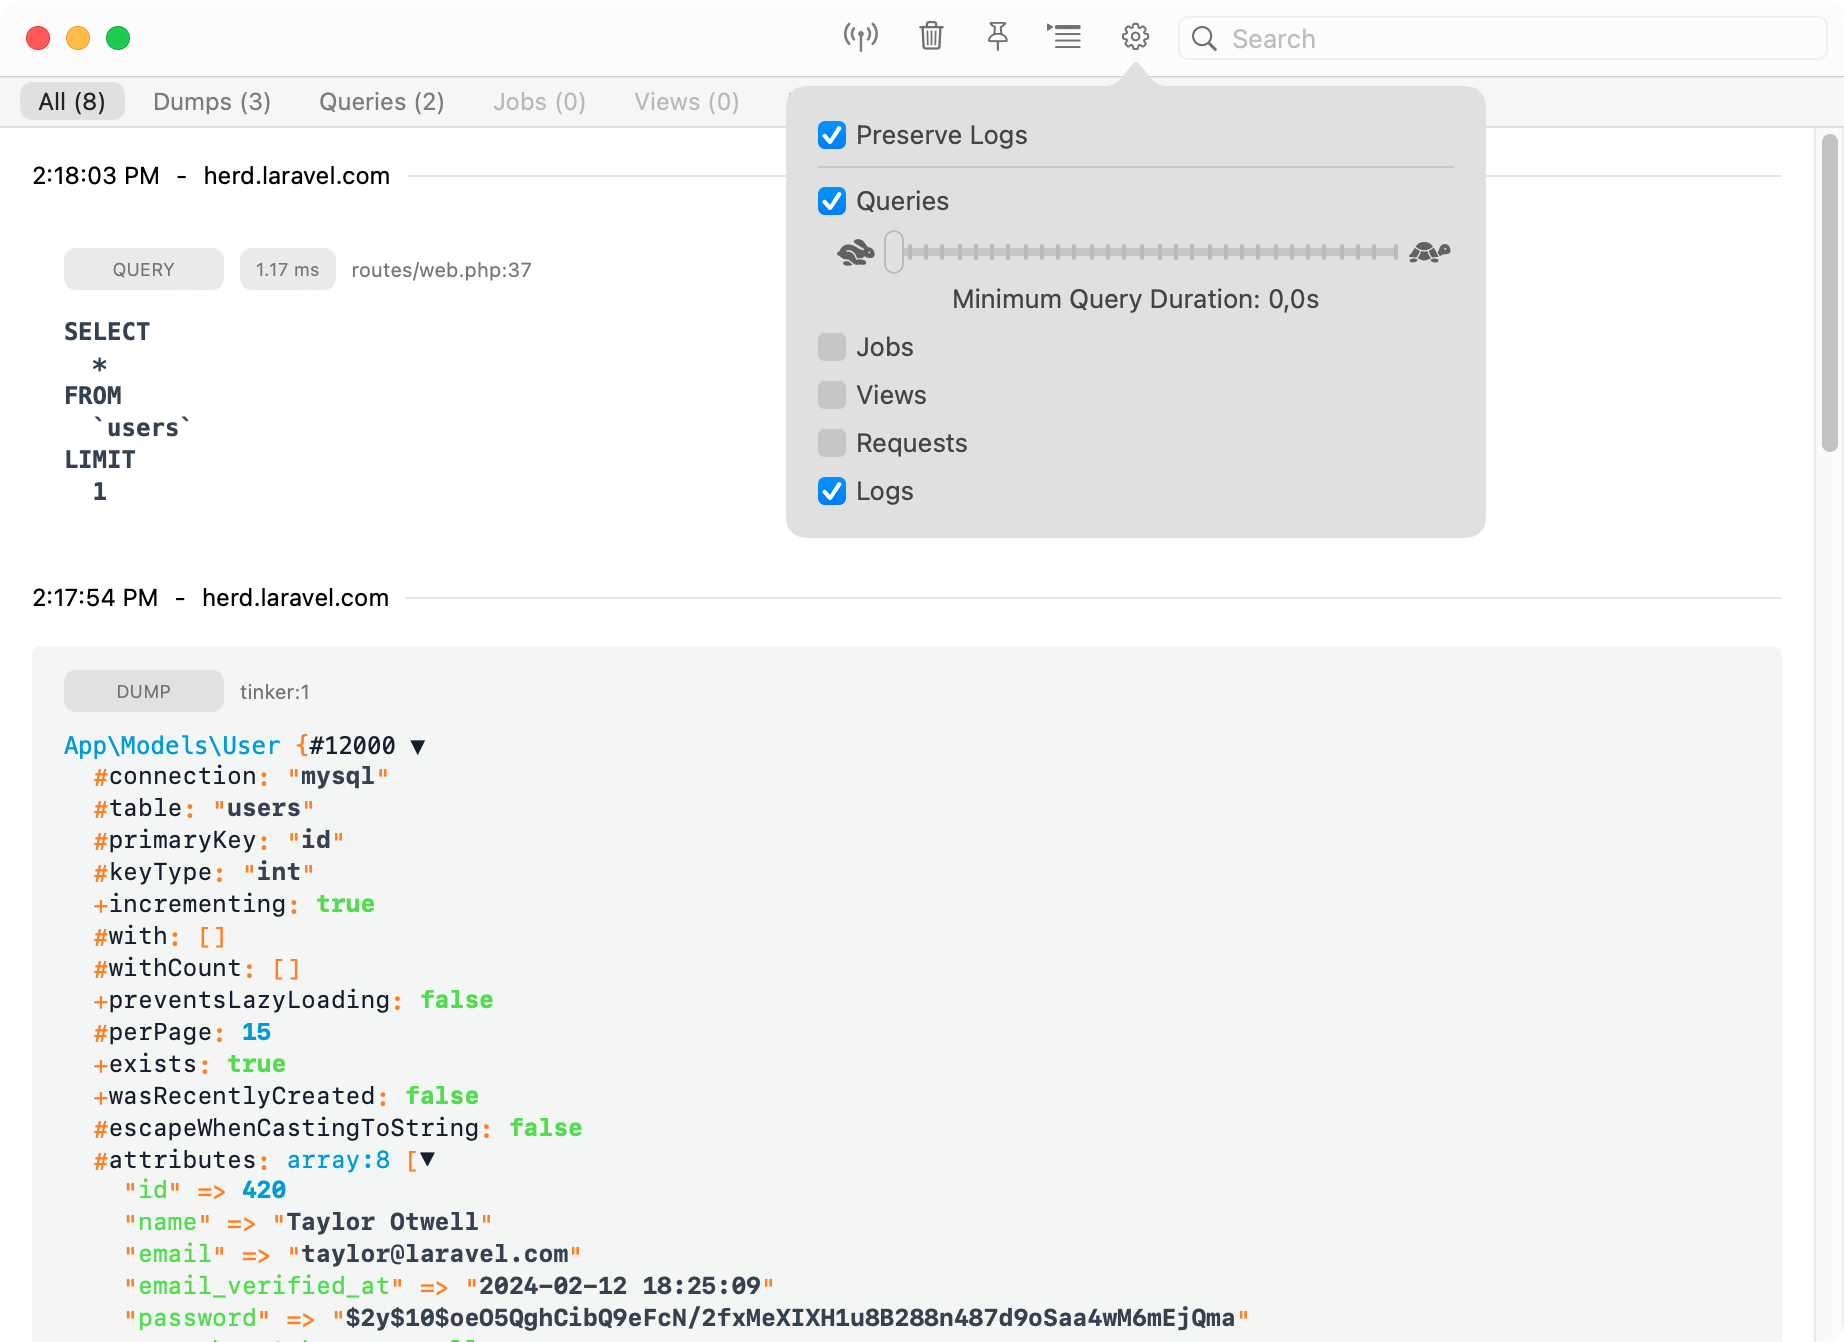
#Dumps
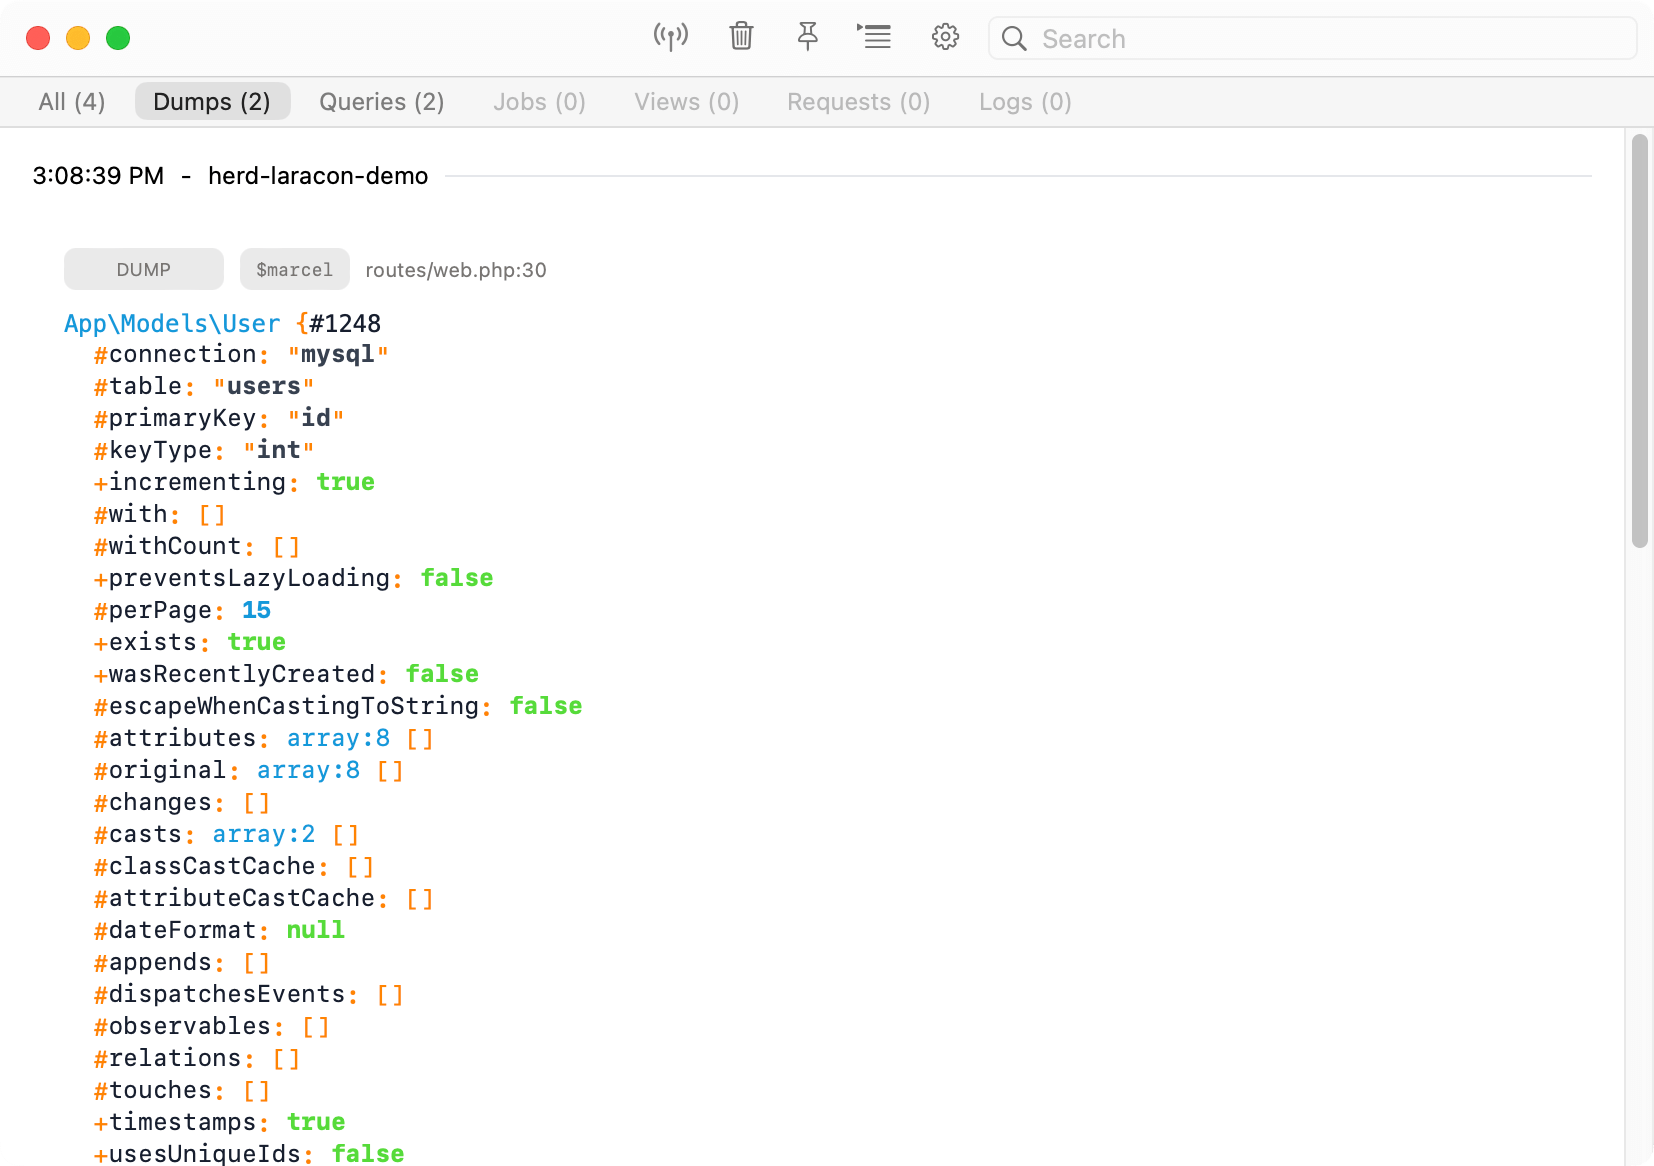
When enabled, all dumps that you run via Laravels' dump() or dd() methods automatically go to the Dumps Windows instead of your browser. This has the advantage that the dump doesn't break your layout and SPAs still work.
This also sends dump() calls from queued jobs to the dump window that you wouldn't see in your browser when working with real queues.
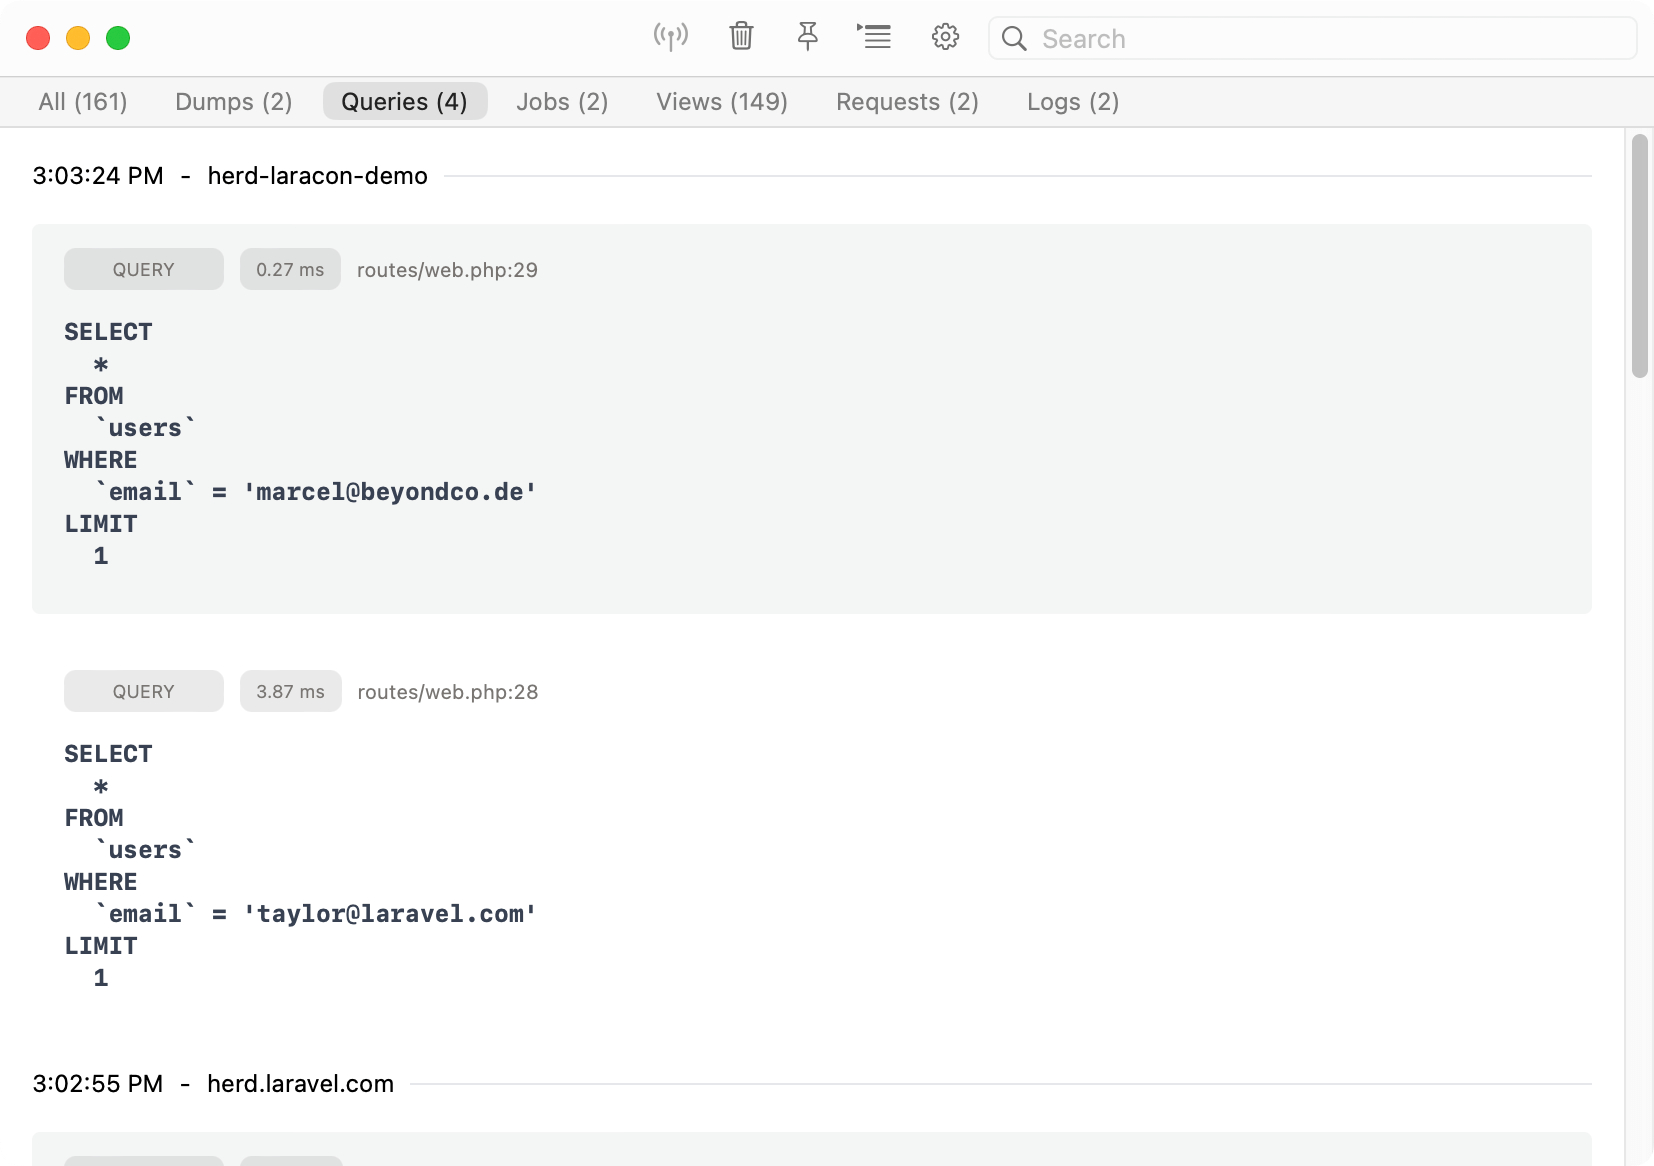
#Queries
You can display and debug Eloquent queries by enabling the query feature in the settings. If you want to debug specific queries, you can select the duration for these queries and skip fast ones which are good to go.
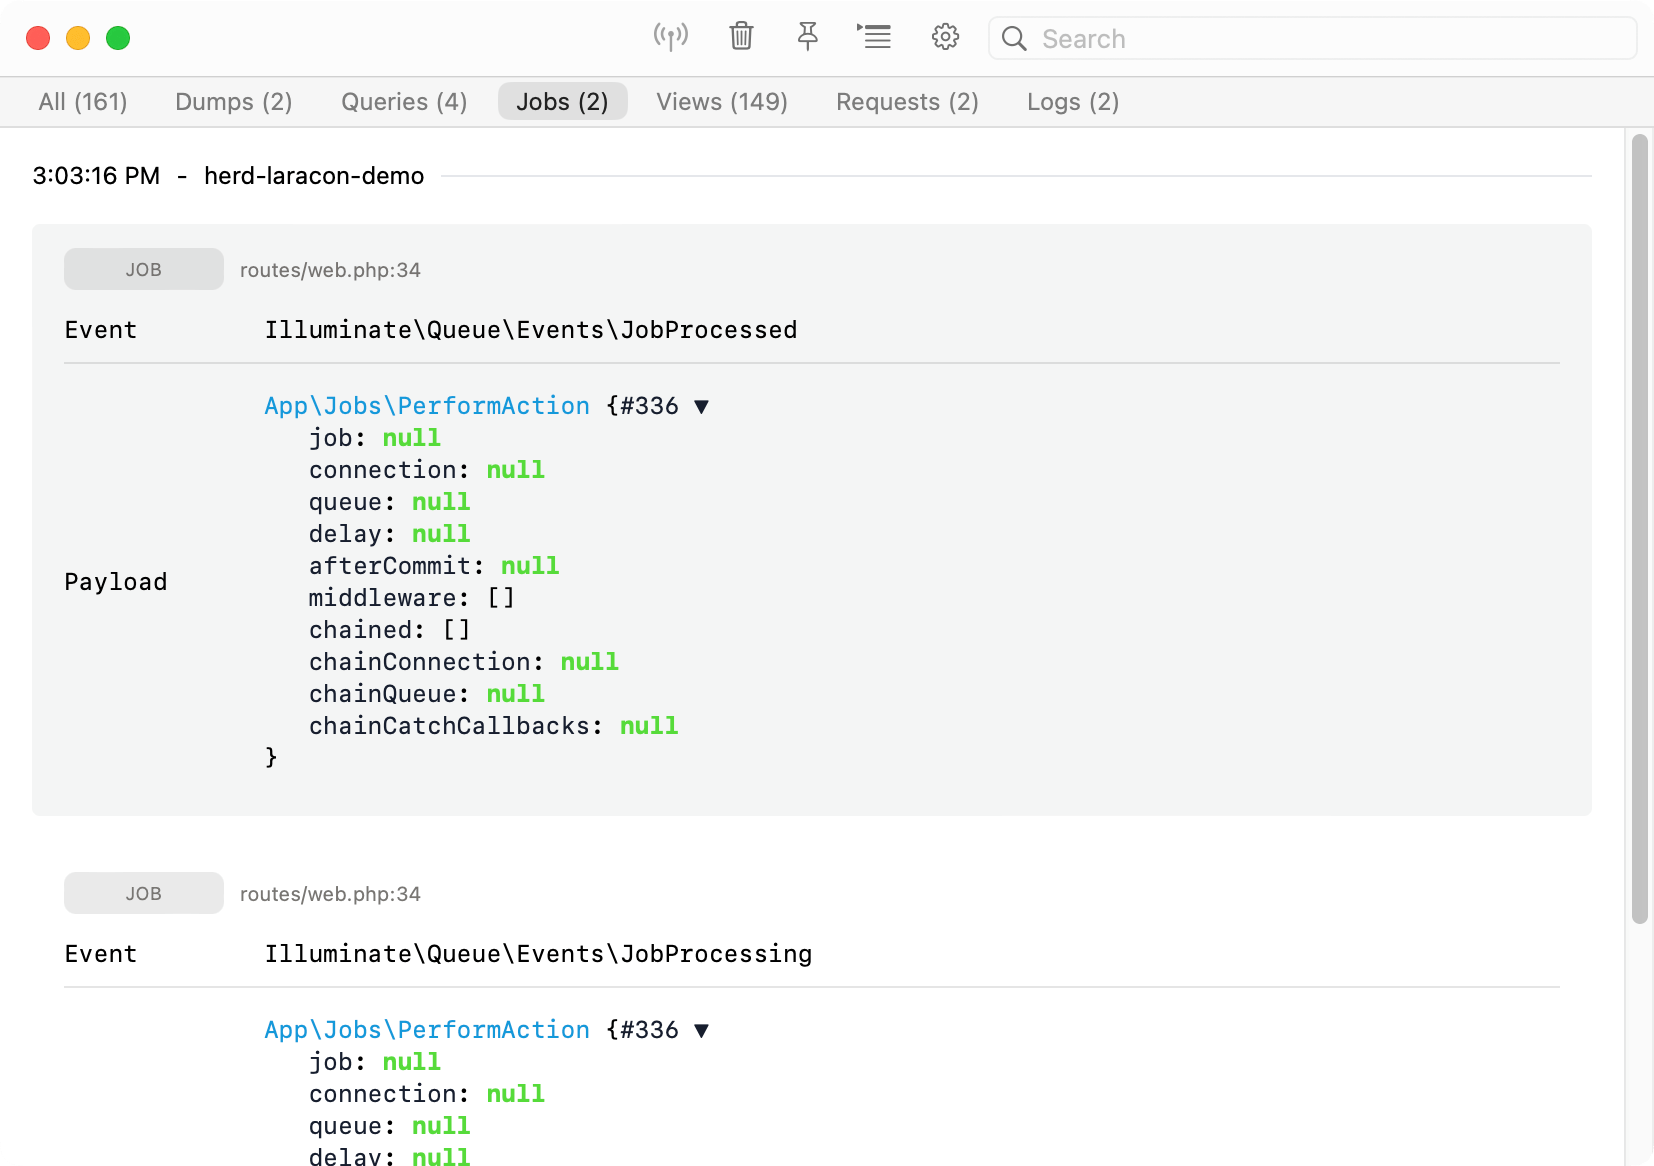
#Jobs
Enable job logging to get a list of all jobs that your application runs. This is super useful when you work with the sync driver and are not sure if all jobs are properly triggered.
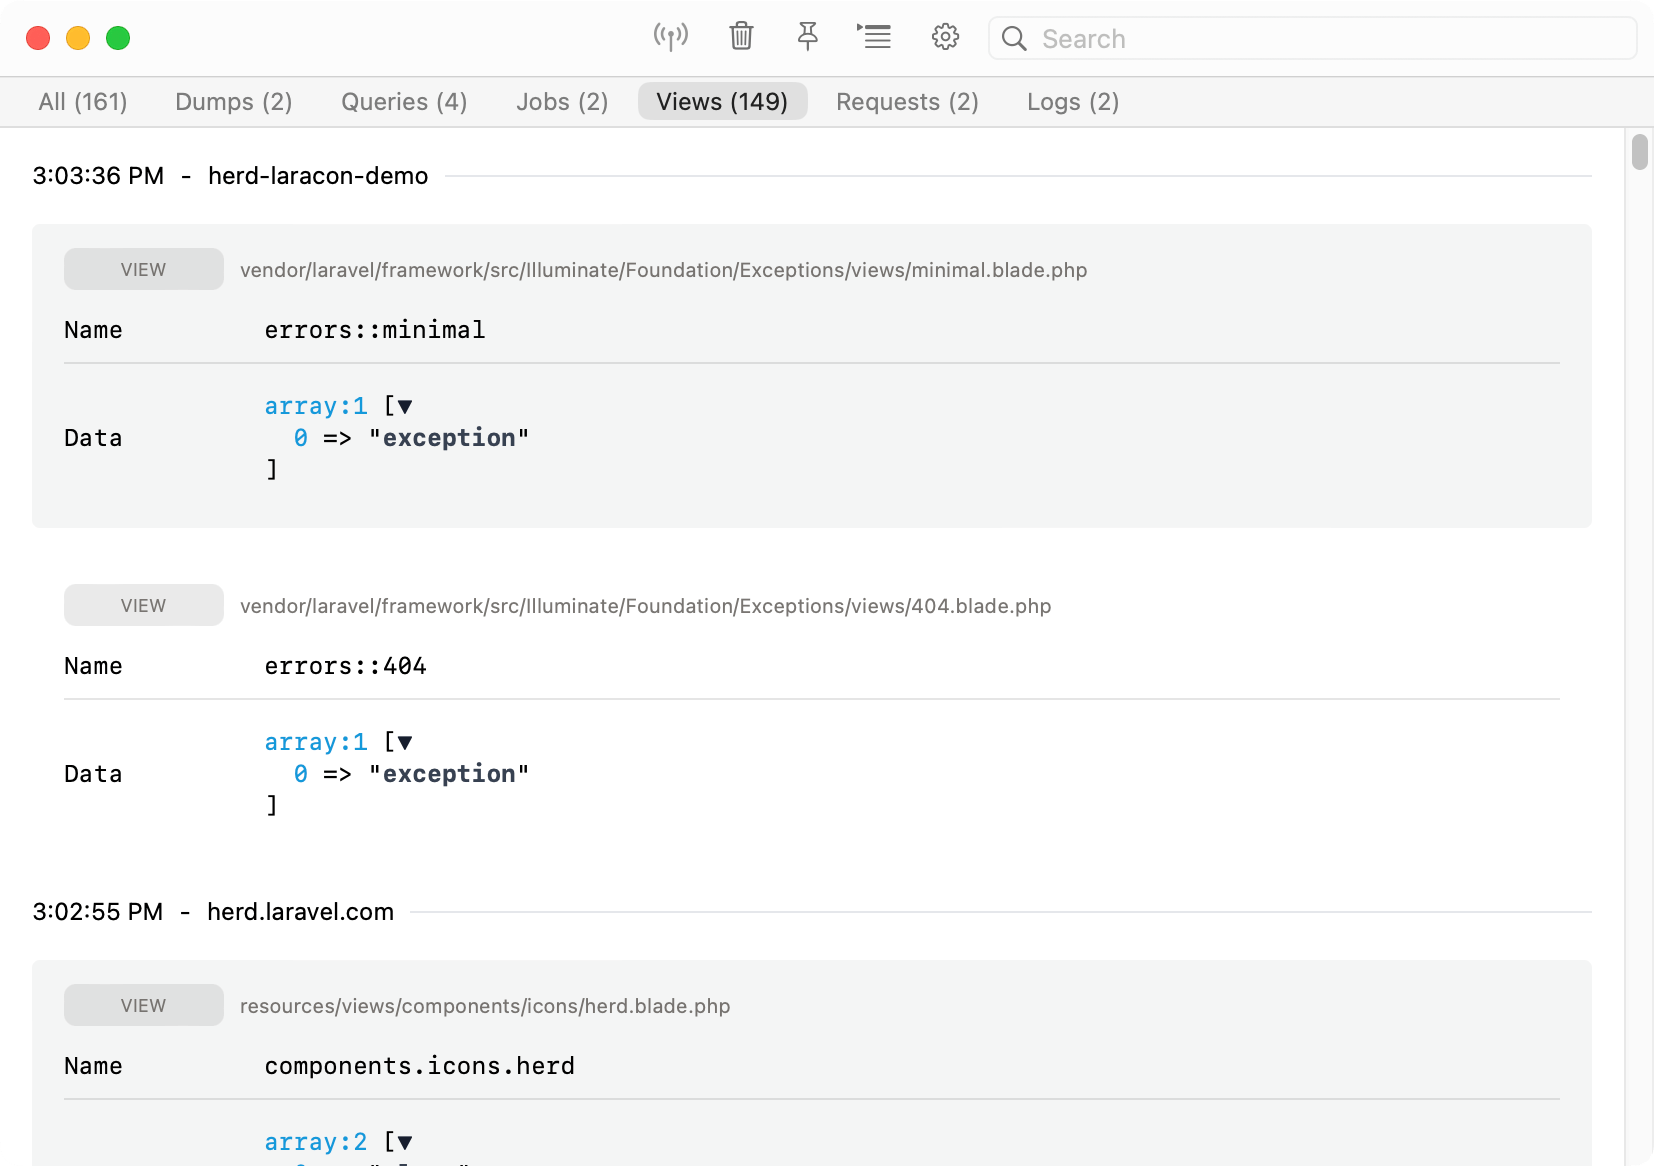
#Views
Sometimes, you want to know which data gets passed to a view and which views your application loads on a specific site. This tab lists all views that Laravel renders during a request.
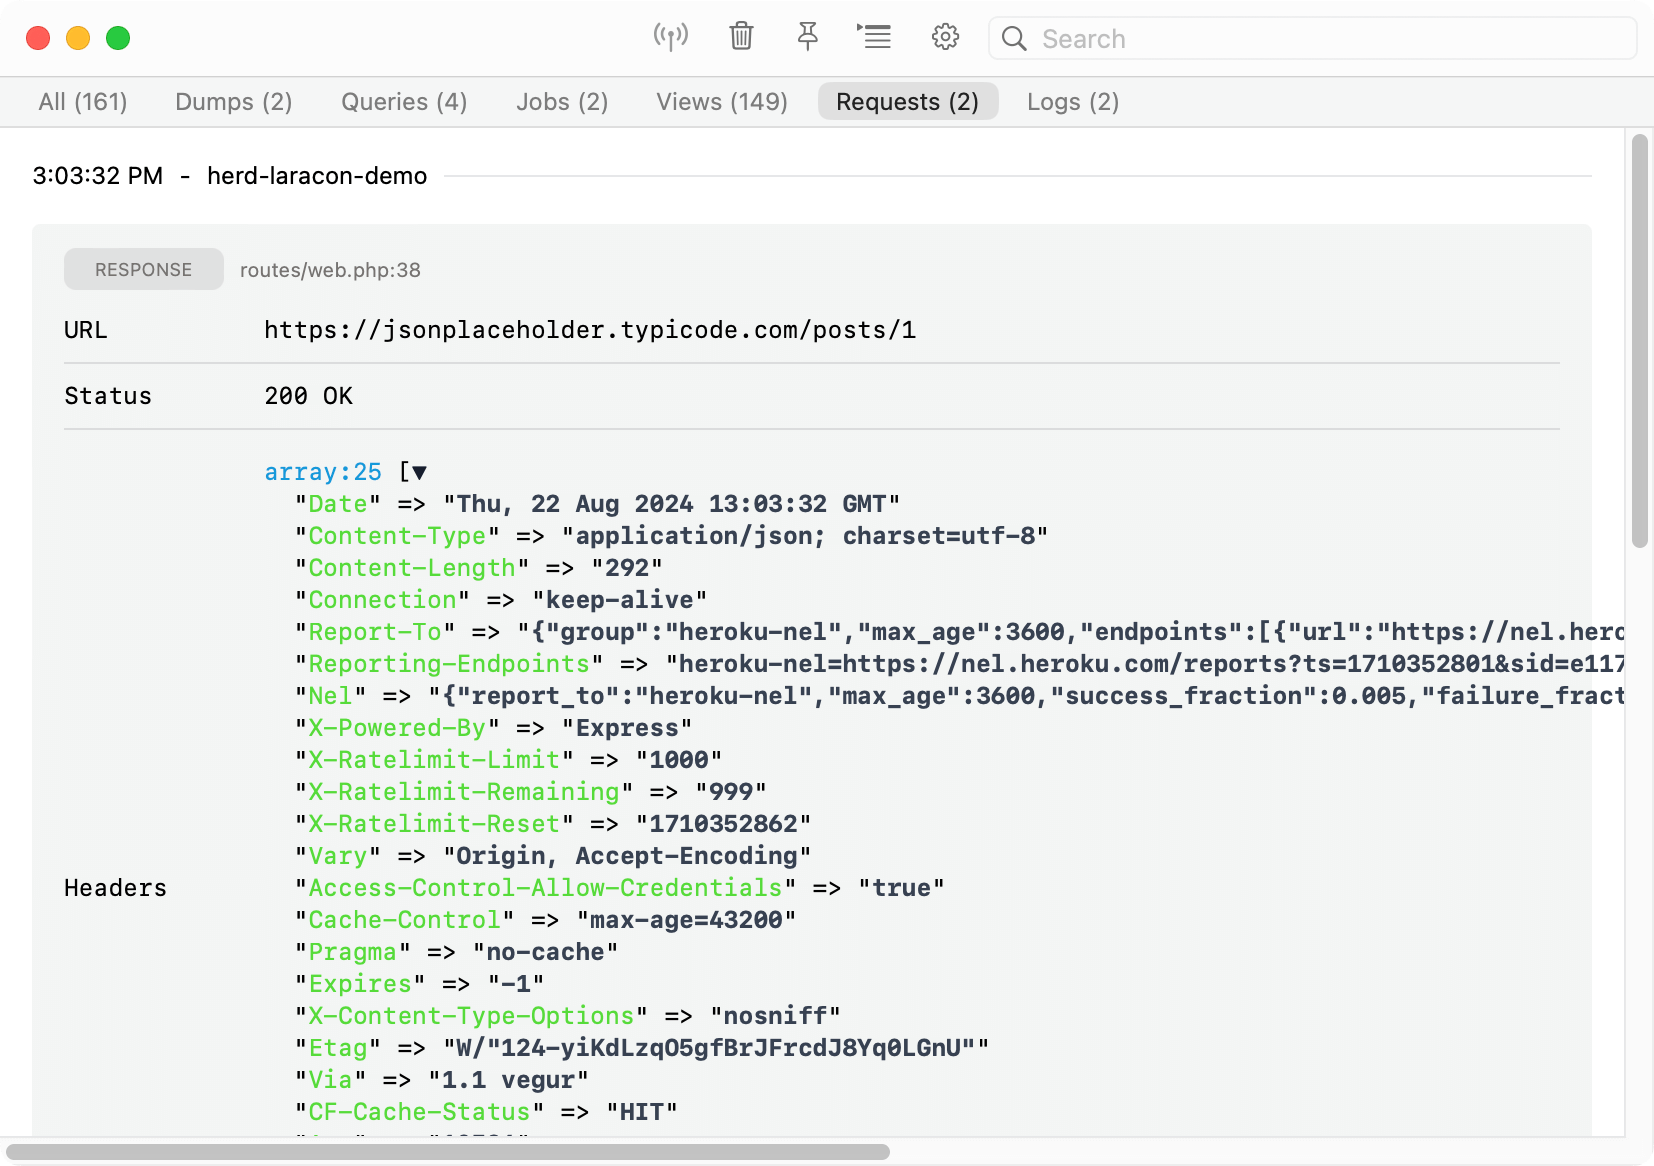
#HTTP
The request tab displays all outgoing HTTP requests of your application, so if you're working with an API, these calls show up in the Dumps Window and allow you to inspect them without searching through logs etc.
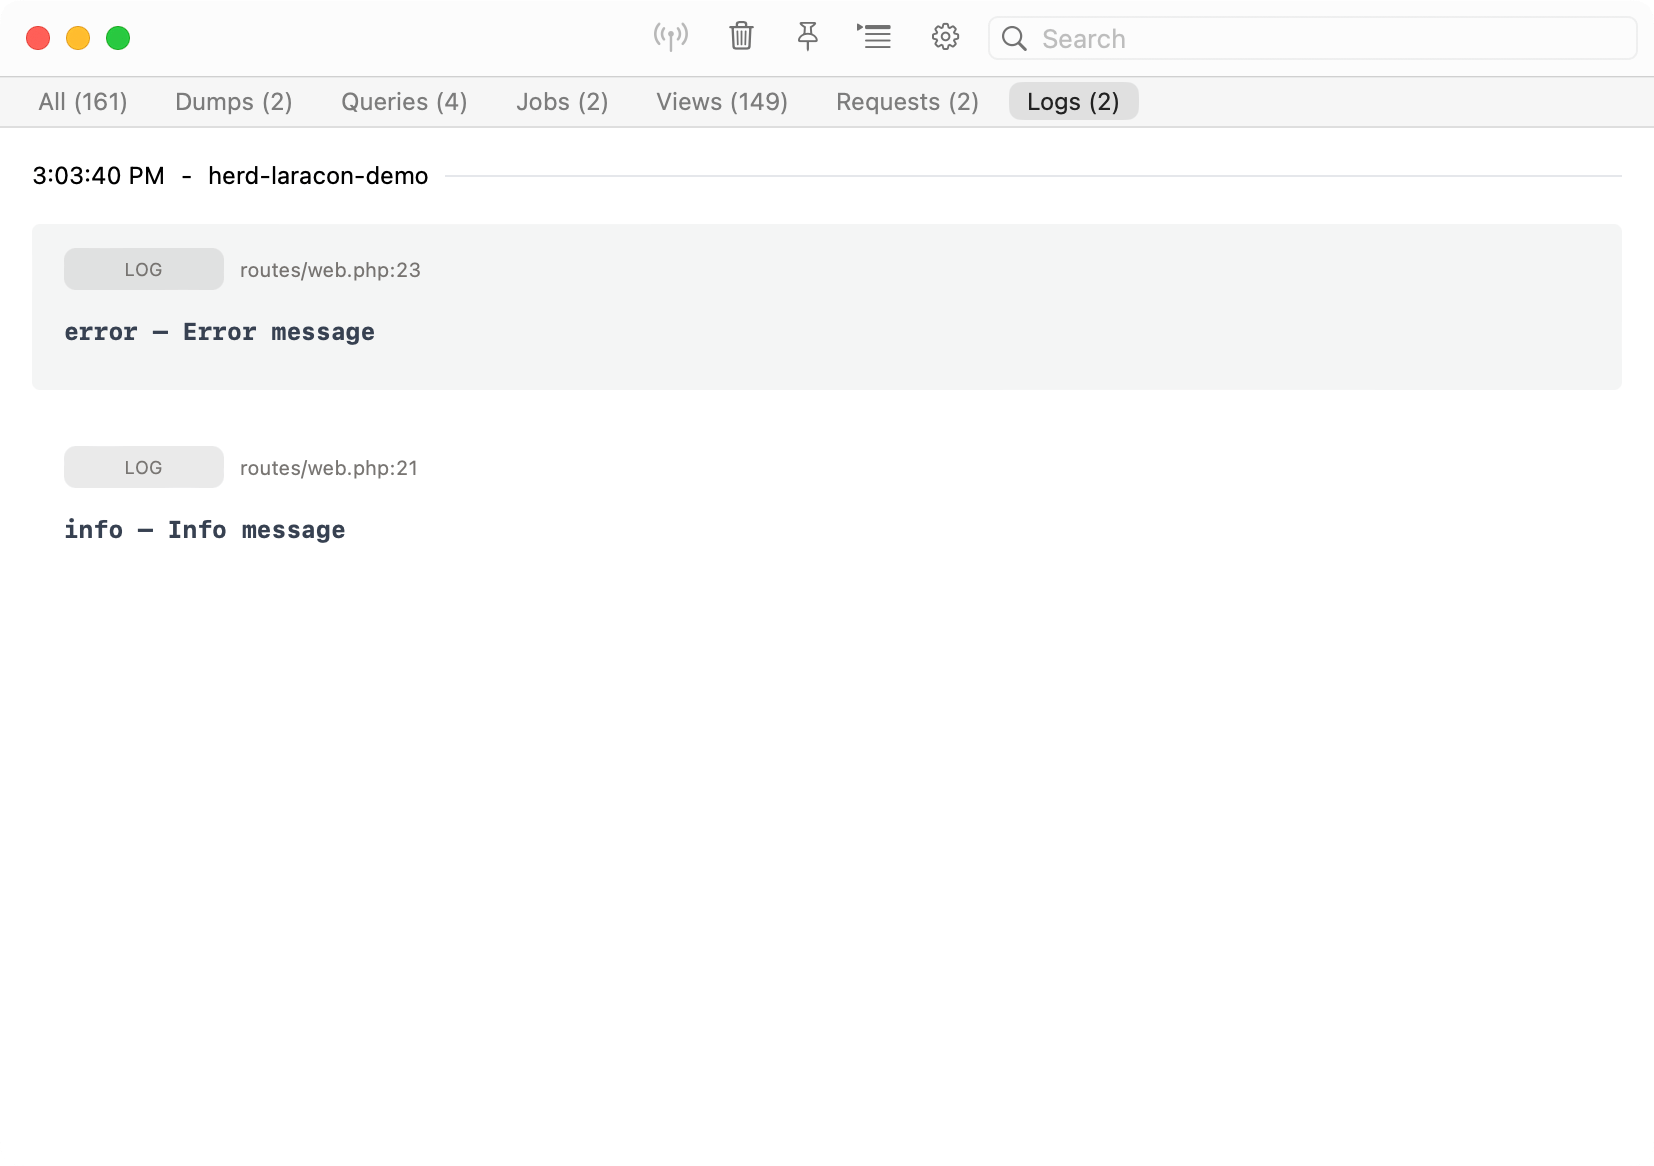
#Logs
You can get all logs of a request without using Herd's Log Viewer or digging through log files.
#Troubleshooting
The dumps feature uses Herds' own PHP extension so make sure it is present in your php.ini and the path to the extension is correct. If you think that there is a problem with the path, simply quit Herd, remove the extension from the ini file and start Herd again. This will add the extension to the configuration file with the correct path.
extension=/Applications/Herd.app/Contents/Resources/herd-ext/herd-83-arm64.soTechnically, Herd uses this extension to inject code into your codebase in very early stages of the bootstrapping process. So if you're facing issues within your application, you might want to disable some or all of the features in the settings.